The Flare profiler for Minecraft servers
Preserving part of Minecraft history by revitalizing the Flare profiler
What is Flare?
Flare is a profiling suite for Minecraft dating from the 1.16 era.
Used to be a competitor to spark and timings, where timings got deprecated and stopped receiving updates
and Flare got abandoned due to the owner's new schedule and therefore lack of time.
Why bringing it back?
No particular reason.
Originally it was a way to put my newfound nuxt skills to the test, and a decently-sized, decently-complex
challenge was a profiler.
Down the road, I came to notice that Flare actually had quite a bit of history and might have played
and important role in the development of its competitor: spark.
Flare was the first profiler to actually use async-profiler and include features like sampling all threads or profile memory allocations, features that will later be implemented into spark in #102 and #290, with the original author of Flare also leaving some comments.
Sadly, because access to the viewer was paid and the viewer itself was closed source, there's not much
evidence it even existed, new members of the community don't even know what it was.
If spark were to be abandoned, all of its modules can be deployed or improved by anyone. Flare didn't get that chance.
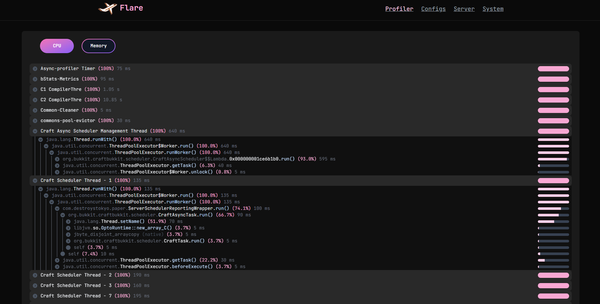
This project aims to give Flare another chance with a fresh UI, similar features and being completely open source.
With the help of @Toffikk it was possible to update the original plugin and fully implement
the viewer from some image references in the original airplane blog.
Flare vs spark
There are not many reasons to use Flare nowadays compared to spark, most of its features have already
been merged into spark and have been enjoyed by server owners for years.
It still has very few features that are not part of spark yet, which are also very niche and not required by everyone,
therefore, more than a competitor to spark it serves as another tool for your repertoire. \
Compared to spark, Flare does not execute in the background, so you don't have to worry about two tools taking
doing the same thing at the same time.
Both use the same engine and don't interfere with each other, which means starting the Flare profiler will not
cause spark to stop, and the performance impact will be as negligible as spark's is.
Features
Most of the features Flare used to advertise are now (and have been) a thing in spark for years.
There's little to no reason for me to try to compete with spark using an abandoned software from the 1.16 days,
while also trying to keep it compatible with the original profiler.
As such, any new feature will be something that spark doesn't cover and is possible to handle using the old
engine Flare currently has.
Old features
- CPU and Allocation profiling. ✨
- Profiling modes ITIMER, CPU, ALLOC, LOCK and WALL.
- View server configurations.
- View system information.
You can get similar results with spark by using /spark profiler start --thread * --not-combined for CPU profiling
and /spark profiler start --alloc --thread * --not-combined for Allocation profiling.
Flare still holds the advantage of being able to sample both cpu and memory at the same time, and being able to select
between multiple profiling modes.
New features
- TPS and MSPT monitoring.
- RAM and CPU usage monitoring.
- Players, Entities, Block entities and Chunk monitoring.
- Garbage collector monitoring. ✨
- Thread usage and allocation monitoring. ✨
Most of these features were already bundled in Flare but were never used due to the UI lacking a tab to display
the collected data.
The only new additions are the packet and thread monitoring, which in addition to the pre-existing garbage collector monitoring,
are features that spark does not display as intuitively as Flare, which shows a graph for each.
Getting started
First, identify your server software.
If you're running Pufferfish or any of its forks, flare its already bundled! No need to install anything!
In your pufferfish.yml file, look for this section and fill up the details.
You will need to provide a URL to the flare instance (the viewer) you're going to use and an authorization token:
# Configures Flare, the built-in profiler
flare:
  # Sets the server to use for profiles.
  url: "https://flare.airplane.gg"

# Options for connecting to Pufferfish/Airplane's online utilities
web-services:
  token: ""
If you're not using a pufferfish-based software, you can still use the Flare plugin
made by @Toffikk.
In your /plugins/Flare/config.yml you'll find the same details, but the URL will be split into backend and frontend.
You only need to provide backend-url with the URL to the flare instance, unless stated by the flare instance you're using.
profiling:
  token: ""
  backend-url: "https://flare.airplane.gg"
  frontend-url: ""
Flare also doesn't fall back to JFR if async-profiler cannot be loaded, like spark does.
This means you have to run the server in a supported platform (Linux or macOS) and be sure your JVM includes debug symbols.
Most JDKs come pre-bundled with debug symbols, so this is only a concern for JDKs installed via a package manager (apt, yum, pacman, etc.).
To verify if your JVM includes debug symbols, you can use GBD to test for the UseG1GC symbol and, if found, the JVM has debug symbols.
gdb $JAVA_HOME/lib/server/libjvm.so -ex 'info address UseG1GC'
Now, optionally, you can add the following JVM flags to your startup script to improve accuracy when profiling.
These flags are not required for Flare to work, but when async-profiler, the tool
that makes both spark and Flare possible, is loaded as a library instead of an agent (way past the JVM startup), the team
recommends to add them.
-XX:+UnlockDiagnosticVMOptions -XX:+DebugNonSafepoints
Once you have provided both a URL and your token, you can start profiling!
In the original Pufferfish and the Flare plugin, you can start profiling
by using the command:
/flare start
In unofficial implementations of Pufferfish like Puffernot you will use the command:
/flare profiler start
No public instances available?
You might be asking: Why does it require a token compared to spark?
As mentioned before, Flare used to be paid, and this feature is part of its legacy which has now been repurposed
to allow the user to control who uses their instance.
Still, you're able to deploy your own instance and share it with your friends, or with the whole community!
For this you will need two projects:
- flare-viewer, the web UI for Flare.
- Jet, the backend for the viewer.
Spark uses two services:
- Bytebin: Storage for completed profilers
- Bytesocks: Opens a socker for live profiling sessions.
Jet will be the equivalent in functionality to both Bytebin and Bytesocks, and flare-viewer to spark-viewer.
You can compile each project by following the instructions on their respective repositories.
Or you can use the provided docker images, available in the GitHub Container Registry (ghcr). You can find the
compose.yml entries I use inside each repository.
As you might notice, there are two projects that, by default, will hold different paths.
This is why the Flare plugin provides a backend and frontend URLs. If you're unable to configure any sort of forwarding,
you can just rely on that feature, where backend-url will be the path for Jet, and frontend-url will be the path for flare-viewer.
If you're using docker, have both projects in the same machine, and are using Caddy, you can take my configuration to make yours forward the connection, and only require to provide a single url (which will also make it compatible with the original Pufferfish).
flare.biquaternions.me {

    handle /create {
        rewrite * /api/v1/profiling/create
        reverse_proxy jet:9420
    }

    handle /license {
        rewrite * /api/v1/profiling/license
        reverse_proxy jet:9420
    }

    handle /api/v1/flare/thumbnail/* {
        reverse_proxy jet:9420
    }

    @profiling {
        method POST
        path_regexp flare_keys ^/[A-Za-z0-9_-]+/[A-Za-z0-9_-]+(/timeline)?$
    }
    handle @profiling {
        rewrite /api/v1/profiling{uri}
        reverse_proxy jet:9420
    }

    reverse_proxy flare:3000

}

jet.biquaternions.me {
    reverse_proxy jet:9420
}